Dear Investors,
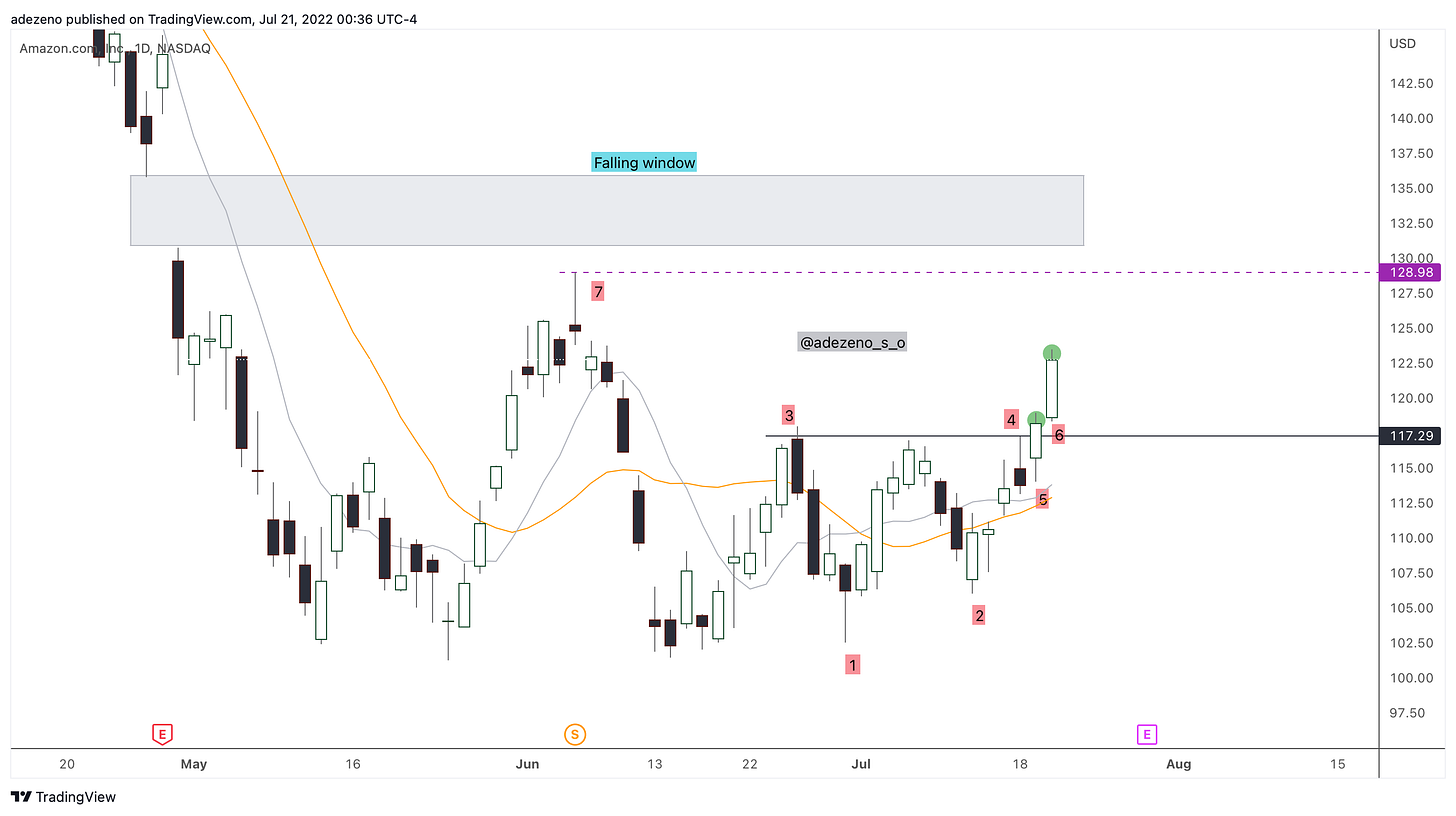
I recently added a position on Amazon. But, first, I will strictly break down how I read the price action candle by candle.
My premium subscriber will dive deeper into the short video I prepared today, looking at Amazon from simple wave structure and classical chart patterns and my target.
Some updates from Crypto space first.
Tips: If you're not in your wallet, it’s not your asset!
Having said that, let’s jump into the Amazon chart
Candle 1 & 2 shows the price making higher high with C1 a hammer and C2 and inside bar (IB).
C3 is a Dark Cloud Cover an advanced bearish candle stick pattern.
C4 is a Shooting Star.
Both C3 & C4 form a strong resistance.
The best entry (Green Dot) would be at candle 5 (C5), a strong bull bar breaking the C3&4 resistance.
2nd Best entry would be C6, where I will only consider entering half position considering the risk is high after pricing so much from the base.
The price target will be at Doji C7
2nd price target will be at the falling window (grey box area)
Watch how candles react when reaching those levels.
Watch with a 7-day free trial
Subscribe to adezeno to watch this video and get 7 days of free access to the full post archives.


